Transport Sector – Decarbonization Pathways for Different City Spaces of Future – An Exploration

Introduction
Imagine a future, where magnetic levitation trains will move passengers through tube ways between states of India! Can Indian cities be like the Chengdu city of China? It is a city which is not planning to build parks within a city but rather a city within a park. It is aiming to create such a city by linking green areas in corridors with walking and biking trails by aiming at a system of absorbing ultimately 17000 km.
The city is being built in a way to address mental health issues, reduce sound and air pollution and address climate impacts. Imagine a scenario, when tomorrow’s cities of India are forced to be like this due to environmental stress on air, water, and ecology created from an unbridled, unbalanced growth. The question to think about is what happens in such a situation for the transportation sector of cities of India and largely for the energy demand of the transport sector of India. For the survival of humanity in such a situation, a balanced growth by balancing economic growth with its impact on water, land degradation, air pollution, spiritual, social and natural capital, transportation sector holds a key.
This is because, transport sector connects people, sectors and creates multiplier for the economy. Hence, any growth in the economy will have its immediate impact on the transportation sector energy demand. It also works the other way where any change in the transportation sector can immediately impact the economy through the network effects and may affect the economy wide multipliers and the corresponding energy demand. The sensitive feedback connection between the energy and economy is driven by various sectors of the economy like transport, industry, commercial, agriculture and residential. Transport holds a key role in such a feedback relationship of energy and economy. Hence, it is important to model a world through an energy economy model to understand the impact of the economic growth on the transportation sector energy demand for future to understand its corresponding consecutive impact on human health, air pollution, human behaviour, mental health and other behavioral aspects of the society.
For a developing country like India, with multiplicities of different cultural patterns across the states, it is an imperative to understand these interconnections. To illustrate, if tomorrow, the entire railways and freight movement of India becomes decarbonized and stops using fossil fuels what will happen?
If we achieve a tomorrow in India, where 85% of passenger vehicles becomes electric through bus electrification by overcoming the upcoming high upfront costs, charging infrastructure requirements – What will happen to the energy demand and the society? What if we move towards a society where passenger mobility of today gets disciplined and restricted through road pricing, carbon taxes, congestion cess and various behavioural nudging policies, awareness campaigns impacting choice and movement of vehicles and mobility at large. Are we prepared to face such a society or a societal transition? What if all our two-wheeler movement gets saturated as like in many other developing countries like China and our trucks are gradually fed in through natural gas and green hydrogen to reduce carbon emissions from trucks and freight sector?
Such a world sounding like fantasy is very much likely to happen in the future and it will create ramifications for the society, economy, energy demand, human, social, natural and physical capital. In order to understand such ramifications, the transport sector energy demand modelling is chosen by the authors. The authors have selected the transport sector of India to model as it plays a crucial role in economic growth and urban development (Singh, 2005). It boosts trade and enhances the overall quality of life by providing access to essential services and improving mobility (S. And & Hallenges, 2011).
As urbanization increases in the country, so does the overall demand for transportation. This rising demand leads to heightened activity levels within the sector, making it a significant contributor to the country’s greenhouse gas (GHG) emissions, accounting for 14% (NITI AAYOG, 2021) of GHG emissions. India aims to achieve a net-zero economy by 2070 and Viksit Bharat by 2047 as part of its commitment to emissions reduction (Ministry of Environment, Forest and Climate Change, 2023). Achieving this goal will require sustained efforts to reduce emissions and continue with balanced economic growth over the coming decades. As a major source of emissions in the country, the transport sector plays a vital role in reaching these climate goals by promoting public transport, integrating renewable energy sources such as electric vehicles, and improving the fuel efficiency of vehicles (De et al., 2020).
In order to understand the above phenomenon, a LEAP platform-based energy -economy, least cost optimization model is chosen. While modeling the transport sector, the constraints imposed on meeting the growing mobility demand in cities included vehicle saturation, constraints on land availability, space availability and urban expansion. LEAP (Low Emissions Analysis Platform), formerly known as Long-range Energy Alternatives Planning, is an energy modeling tool used for energy and environmental policy analysis and decision-making. This OPED article highlights some of the findings of the India’s energy system model using LEAP model specifically for the transport sector, analyzing energy demand patterns for a certain level of economic growth. The model considers GDP, population, urbanization, and sectoral growth from the transport sector serve as inputs for the model (Goswami, Kedia, & Gurtu, 2020).
LEAP uses fuel efficiency and activity levels associated with the sector to project future energy demand. It also enables users to analyze the environmental impacts, such as GHG emissions or air pollutants related to the sector. However, for the current results and modelling, externalities like GHG emissions or air pollution resulting from the sector have not been considered. Our transport sector model on LEAP can assist policymakers in assessing the robustness and effectiveness of their policy decisions (Goswami, Kedia, & Gurtu, 2020). The intuitive structure flow of our transport model on LEAP is as follows:
Modelling:
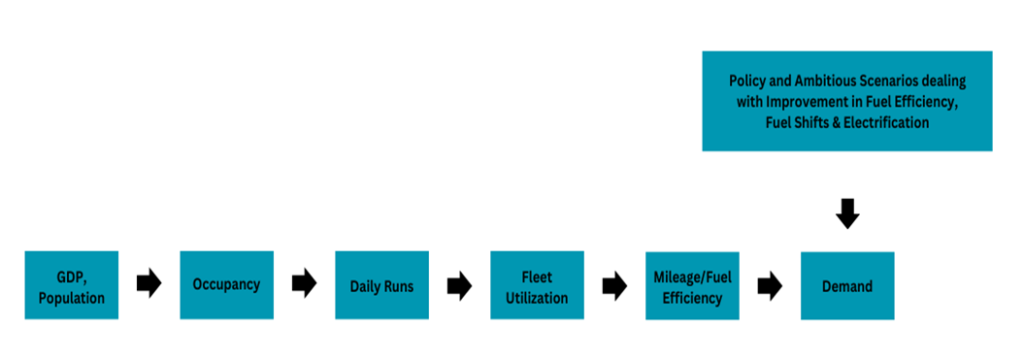
Figure 1: Intuitive Structure Flow
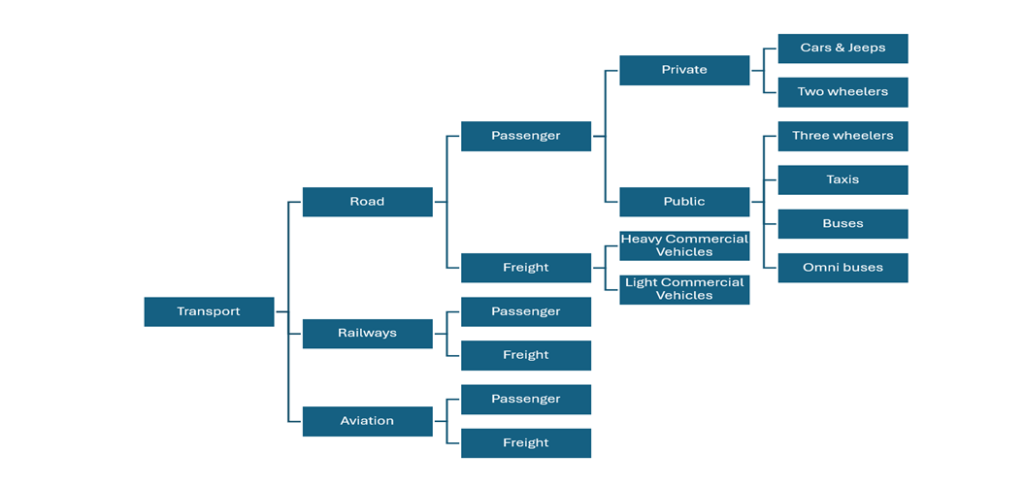
Figure 2: Transport Sector Segmentation for Energy Demand Analysis
Figure 1 indicates that as an economy’s GDP, population, urbanization grows, the overall vehicle movement/ activity level increases across roads, railways, and aviation, measured in BPKM (for passengers) and BTKM (for freight). This leads to an increase in energy demand for vehicles like cars, jeeps, two wheelers, three wheelers, taxis, buses, heavy and light commercial vehicles – each operating with specific occupancy rates and saturation levels. These increased activity levels combined with how efficiently the fleet is utilized and each vehicle’s fuel efficiency/consumption determines the energy demand across India’s entire transport network. In our model, we have created two energy scenarios in addition to the baseline to analyze how improving fuel efficiency, encouraging fuel shifts, and promoting EVs across the transport sector can bring the energy demand down.

Source: Adapted from Goswami, Kedia, & Gurtu, 2020
Figure 3: The Framework based on the Low Emissions Analysis Platform (LEAP) by (Goswami, Kedia, & Gurtu, 2020).
The projections depend on the following assumptions for the model as shown in Table 1.
| Key assumptions | 2020 (Base year) | Source of base year data |
| Income (per capita) (in USD) | 1044 | RBI Statistics (Handbook of Statistics on Indian Economy) |
| Population | 1370 million | RBI Statistics (Handbook of Statistics on Indian Economy) |
| Household Size | 4.1 | Ministry of Statistics and Programme Implementation (2020-21) |
| Households | 2.69 million | Ministry of Statistics and Programme Implementation (2020-21) |
| Per Capita Income Growth Rate | 4% | RBI Statistics (Handbook of Statistics on Indian Economy) |
| Population Growth_Rate with gradual satiation as per the demographic model projections | 2% | RBI Statistics (Handbook of Statistics on Indian Economy) |
| End Year Urbanization Rate | 31.9% | RBI Statistics (Handbook of Statistics on Indian Economy) |
| GDP (per capita) (in INR) | Rs. 65787 | RBI Statistics (Handbook of Statistics on Indian Economy) |
Table 1: Key Assumptions used in the ACPET LEAP Model for India’s Transport sector
In order to further understand the future projections of transport sector specific energy demand, three scenarios have been constructed –
1. Reference scenario: The business-as-usual scenario is structured to provide a baseline showing how the energy trajectory would evolve, provided current trends in the economy, energy demand, and supply are not changed and the trajectory of economy and demand continues as expected in the normal years with no structural change.
2. Policy scenario: A scenario that examines how increased fuel efficiency across all modes of transport, one mode at a time, would impact the energy trajectory. The scenario is in sync with the policy horizon created by the various policy documents of the country for the transport sector. The fuel efficiency is assumed to improve by 1% every year for vehicle categories like taxis, cars & jeeps, three wheelers, two wheelers and by 0.25% every year for vehicles like buses and heavy commercial vehicles considering the net zero time horizon of 2070 for India.
3. Ambitious scenario: A scenario that assesses how fuel & technology shifts in addition to increased fuel efficiency across all modes of transport, one mode at a time (policy scenario), would impact the energy trajectory by including some of the fantasy situation of adoption of a city structural planning like Chengdu, decarbonisation of railways and freight, electrification of buses, natural gas, green hydrogen based movement of trucks and so on and so forth.
After construction of the scenarios, an inter-model comparison of the ACPET Transport Model was also done for the energy demand projections for the road vehicles under the reference/ baseline scenario for years 2030, 2040 and 2050. The projections from the following organizations were considered for the comparison:
1. TERI 2. CEEW 3. CSTEP 4. PNNL 5. IRADe
Results and Comparison:
BPKM, BTKM and Energy demand Comparisons
Figures 4, 5, and 6 indicate that between 2030 and 2050, compared to the baseline of 2020, the ACPET transport model projects a growth of 2% to 3% in BPKM, BTKM, and energy demand for the baseline scenario. For the other transport models of TERI, CEEW, CSTEP, IRADE, and PNNL, the same rise in BPKM, BTKM, and energy demand is projected at 4% to 5% where the TERI model sees a steep rise in the energy demand by 2050 in the baseline scenario itself.
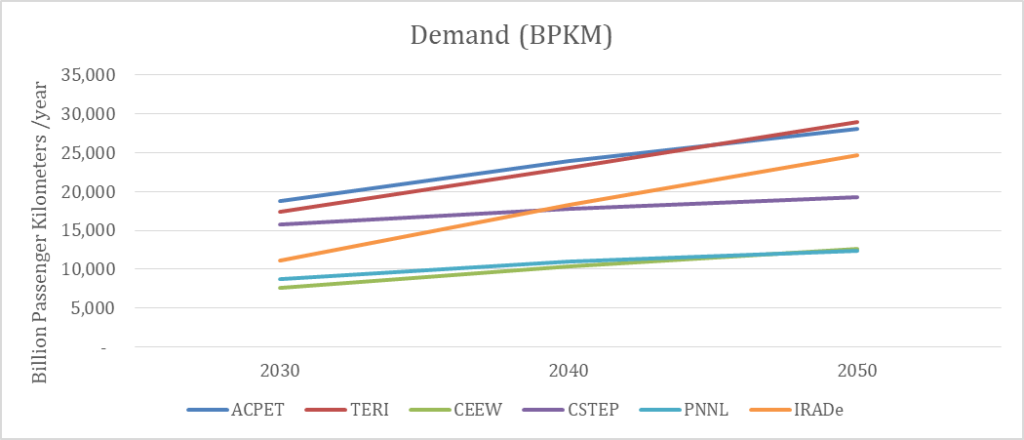
Figure 4: BPKM demand Across Various Institutional Models

Figure 5: BTKM Demand Across Various Institutional Models

Figure 6: Energy Demand across Various Institutional Models
A broad pattern that emerges from the BPKM, BTKM and Energy Demand comparisons across the models is kind of a saturation pattern in the demand growth in all the models except the TERI model which indicates a steep rise of energy demand even in the baseline scenario. In all the other models in the baseline scenario, the growth in demand of round trips for each vehicle goes up, tapers down and then finally stabilises. The exact degree of the rise, tapering and stabilisation across the models do vary but there is no change in the broad pattern. This clearly hints that even within a baseline of all models except TERI, unbridled economy linked exponential energy growth within the transport sector is not possible. The energy demand pattern subtly indicates towards a steady state convergence pattern within the energy demand rise in all the transport sector models other than TERI.
One of the reason for this steady state pattern in all these models can or may be due to the fact that an economic growth bundled with energy inputs acts like an entropy system and a throughput where till a certain extent the energy and economy grows in consonance with each other. However, such a consonant and concomitant growth, thereafter, creates wastes, pollution, impact on physical, social and natural capital which acts as a push back to the economic system and finally to the perpetual economic and energy growth.
Such a push back is realised in the tapering and stabilisation of the growth rate as shown in the Tables 2,3, and 4.
Table 2: BPKM Demand Growth Comparison Across Models
| Unit – BPKM/yr | CAGR 2030 | CAGR 2040 | CAGR 2050 |
| ACPET | 1% | 2% | 2% |
| TERI | 4% | 3% | 3% |
| CEEW | 5% | 4% | 3% |
| CSTEP | 4% | 3% | 2% |
| PNNL | 4% | 3% | 2% |
| IRADe | 4% | 5% | 4% |
Table 3: BTKM Demand Growth Comparison Across Models
| Unit – BTKM/yr | CAGR 2030 | CAGR 2040 | CAGR 2050 |
| ACPET | 3% | 3% | 3% |
| TERI | 8% | 8% | 7% |
| CEEW | 5% | 5% | 4% |
| CSTEP | 7% | 6% | 6% |
| PNNL | 5% | 5% | 5% |
| IRADe | 9% | 7% | 6% |
Table 4: Energy Demand Growth Comparison Across Models
| Unit -Exajoules/yr | CAGR 2030 | CAGR 2040 | CAGR 2050 |
| ACPET | 1% | 1% | 1% |
| TERI | 5% | 4% | 4% |
| CEEW | 4% | 4% | 4% |
| CSTEP | 5% | 3% | 2% |
Insights and Conclusions
Some of the reasons of such tapering down, even in the baseline scenario, can be due to a paradigm shift in the thought process of people as the energy demand grows over time. Even for a baseline situation, people’s perception about the concept of energy conservation behaviour can change within the transport sector. This can lead to a larger saturation of vehicles, larger modal shift in the transport, greater fuel efficiency standards within the existing scenario itself.
The carrying capacity of infrastructure may stay constant within a baseline scenario which means it can only accommodate a certain amount of vehicle on the road. This is because cities can only handle so much growth before the impact on infrastructure, ecology, and human capital becomes unsustainable. People within the city may also turn towards non-motorized transport due to growing energy conservation awareness and a lack of political action towards saving ecological resources of a city.
For instance, the city of Chengdu, within its own baseline scenario, changed the concept of city design making it less energy intensive, which reduced energy demand by redefining the space of the city itself. Within the existing policy space of India, if such rapid shifts can happen, energy demand for India’s transport sector may be reduced by 18%, and with more aggressive modal shifts, fuel efficiency measures backed by new forms of city space designing, the energy demand of the transport sector can go down by 23% by the year 2050 as projected by the ACPET LEAP Transport Model. This type of city design will promote the use of electric vehicles, make vehicles more energy-efficient, and promote shifts to cleaner fuels like CNG.
Furthermore, every city of India is a different cultural, climatic and geographical space. Strategies and policies to reduce energy demand must be sensitive to these diverse needs and contexts. Once this is achieved, the transition to sustainable transport, in alignment with India’s climate and net zero commitments, will be realized in the long term, by 2047 and beyond!
References
- And, S., & Hallenges (2011). Shanghai Manual – A Guide for Sustainable Urban Development in the 21st Century.
- AAYOG, N. (2021). MOBILISING FINANCE FOR EVs IN INDIA.
- Chaturvedi, V., Ghosh, A., Garg, A., Avashia, V., Vishwanathan, S. S., Gupta, D., … & Prasad, S. (2024). India’s pathway to net zero by 2070: status, challenges, and way forward. Environmental Research Letters, 19(11), 112501.
- De, K., Majumder, S., Kumar, P., & Biswas, P. (2020). How Can India Achieve Sustainable Transportation Goals Through Electrification?
- Goswami, A., S.Kedia, A. Gurtu (2020). A Template For Long-Range Energy Planning With Environmental Considerations For Developing Countries: A Case Study. Oil and Gas European Magazine. 69. 37-70.
- Singh, S.K. (2005). Review of Urban Transportation in India. The Journal of Public Transportation, 8, 5.
Anandajit Goswami (Research Fellow, Ashoka Centre for People Centric Energy Transition, Professor, MRIIRS, Visiting Professor, IMPRI)
Navya (Junior Research Associate, Ashoka Centre for People Centric Energy Transition)
Disclaimer: Views expressed are personal


